SuperPlots
jmv_superplots.RdSuperPlots
Arguments
- df
data frame containing data to be plotted
- groups
name of data frame column containing group levels information
- replicate
name of data frame column containing replicate levels information
- value
name of data frame column containing values to be plotted on y-axis for each group, replicate
- font_size
font size parameter passed to cowplot::theme_cowplot() function
- ylab
Label for the y-axis of plot
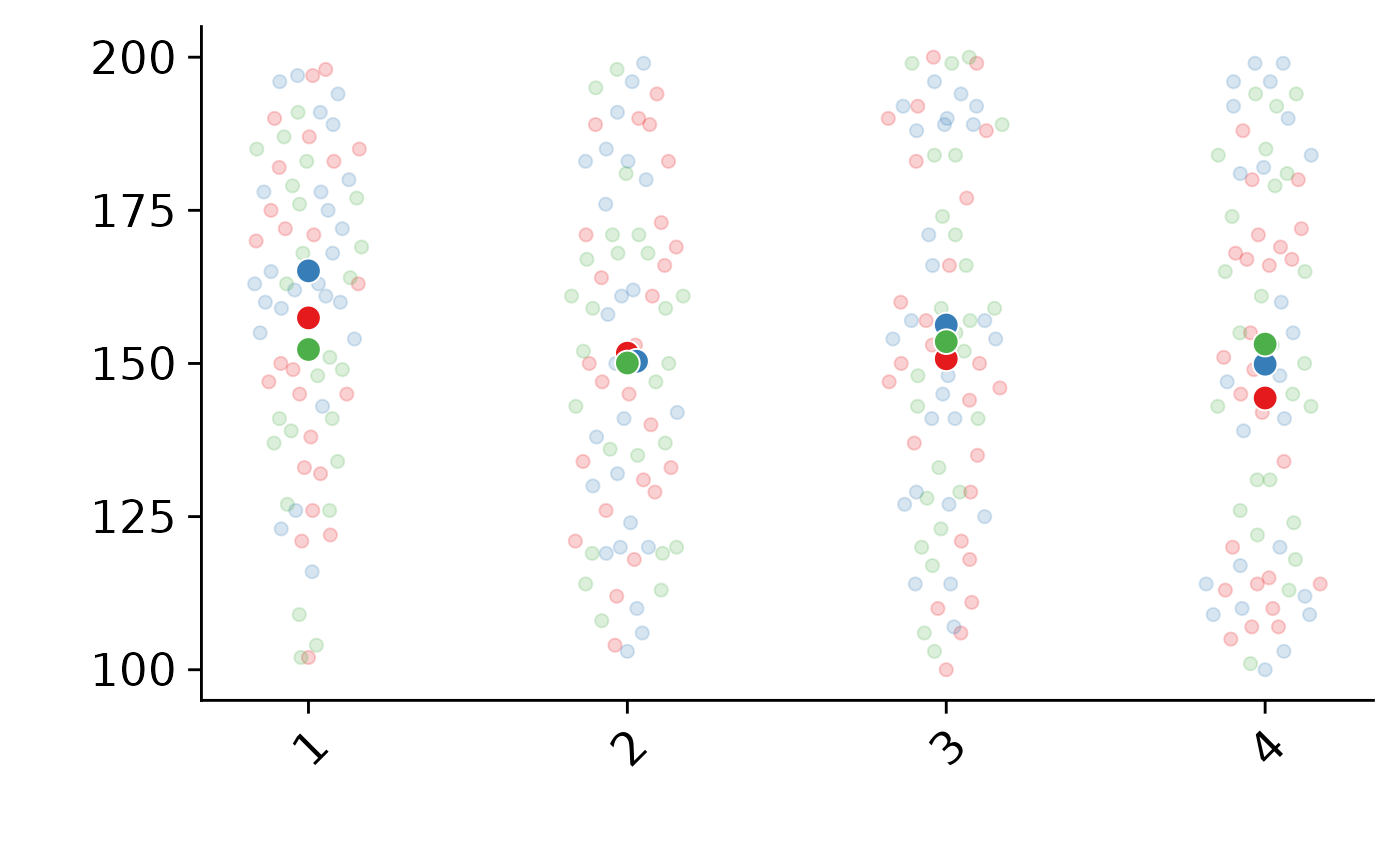
Examples
df_1 <- data.frame(value = sample(100:200, 100, replace=TRUE),
                  group = rep(1:4, 25),
                  replicate = 1)
df_2 <- data.frame(value = sample(100:200, 100, replace=TRUE),
                   group = rep(1:4, 25),
                   replicate = 2)

df_3 <- data.frame(value = sample(100:200, 100, replace=TRUE),
                   group = rep(1:4, 25),
                   replicate = 3)

df <- do.call(rbind, list(df_1, df_2, df_3))
jmv_superplots(df, groups = group, replicate = replicate, value = value)