Rotate a 2D plot by specified number of degrees
ggrotate_xy.RdRotate a 2D plot by specified number of degrees
Arguments
- df
Original dataframe object
- x
Name of column containing data plotted on x-axis
- y
Name of column containing data plotted on x-axis
- deg
Degrees to rotate the plotted data
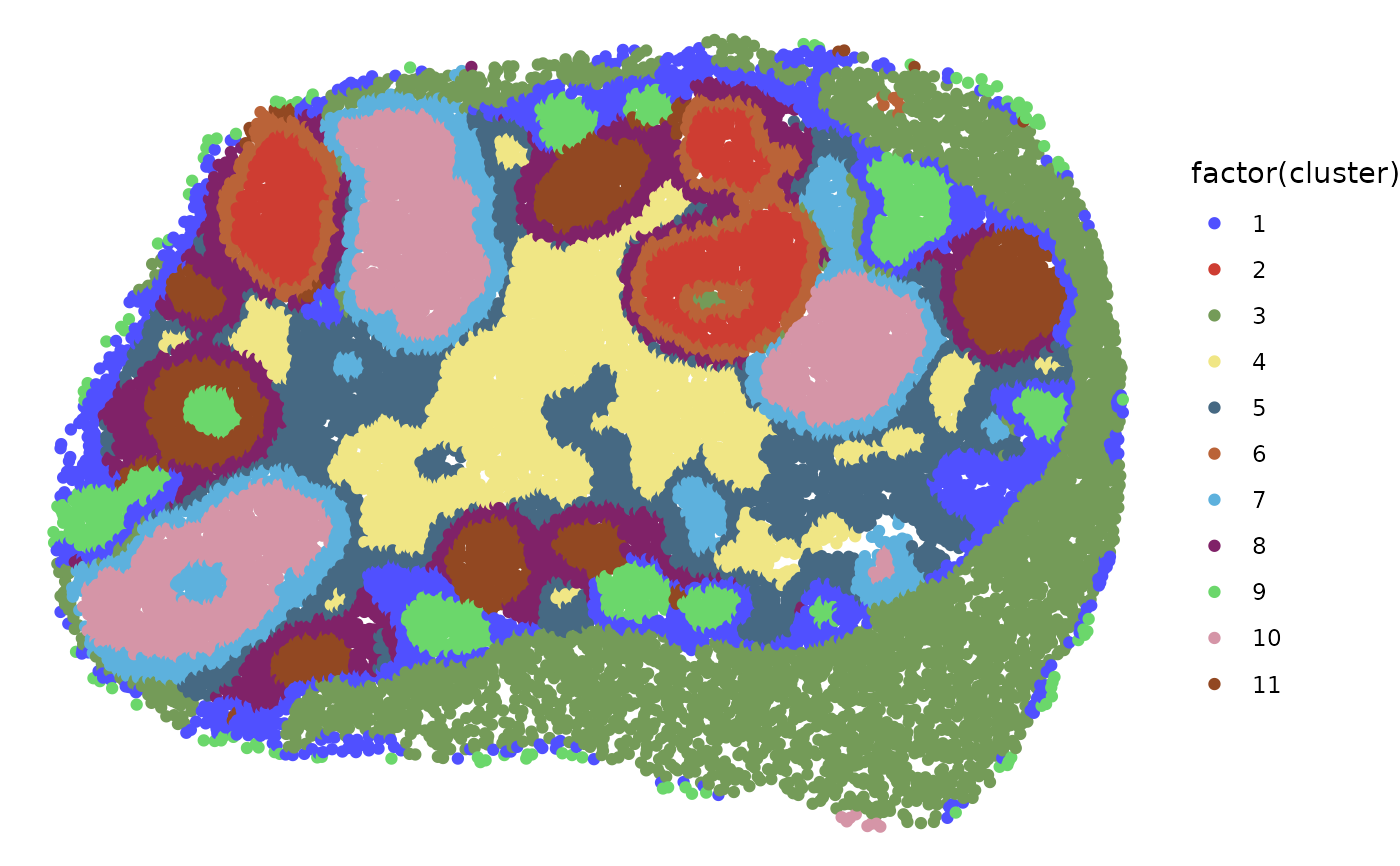
Examples
library(jmvtools)
jmvtools:::spatial_data |>
    ggplot2::ggplot(ggplot2::aes(x, y, color=factor(cluster))) +
    ggplot2::geom_point() +
    ggplot2::theme_void() +
    ggsci::scale_color_igv()


jmvtools:::spatial_data |>
    ggrotate_xy(x, y, deg=90) |>
    ggplot2::ggplot(ggplot2::aes(x, y, color=factor(cluster))) +
    ggplot2::geom_point() +
    ggplot2::theme_void() +
    ggsci::scale_color_igv()
jmvtools:::spatial_data |>
ggrotate_xy(x, y, deg=90) |>
ggplot2::ggplot(ggplot2::aes(x, y, color=factor(cluster))) +
ggplot2::geom_point() +
ggplot2::theme_void() +
ggsci::scale_color_igv()